Using Heap Snapshot
You can take a Heap Snapshot from your running application and load it into Chrome Developer Tools to inspect certain variables or check retainer size. You can also compare multiple snapshots to see differences over time.
Warning
When creating a snapshot, all other work in your main thread is stopped. Depending on the heap contents it could even take more than a minute. The snapshot is built in memory, so it can double the heap size, resulting in filling up entire memory and then crashing the app.
If you're going to take a heap snapshot in production, make sure the process you're taking it from can crash without impacting your application's availability.
How To
Get the Heap Snapshot
There are multiple ways to obtain a heap snapshot:
- via the inspector,
- via an external signal and command-line flag,
- via a
writeHeapSnapshotcall within the process, - via the inspector protocol.
1. Use memory profiling in inspector
Works in all actively maintained versions of Node.js
Run node with --inspect flag and open the inspector.
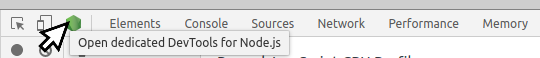
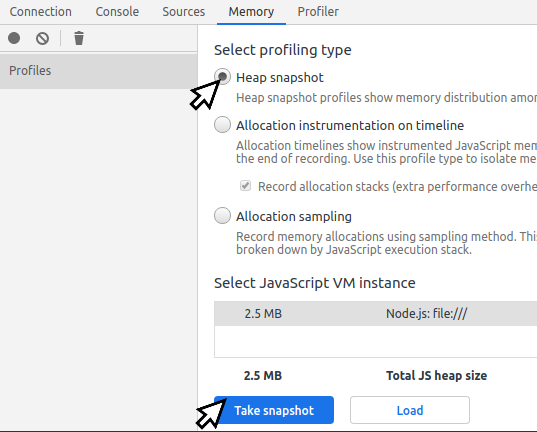
The simplest way to get a Heap Snapshot is to connect a inspector to your process running locally. Then go to Memory tab and take a heap snapshot.
2. Use --heapsnapshot-signal flag
Works in v12.0.0 or later
You can start node with a command-line flag enabling reacting to a signal to create a heap snapshot.
$ node --heapsnapshot-signal=SIGUSR2 index.js
- Let the process load all sources and finish bootstrapping. It should take a few seconds at most.
- Start using the functionality you suspect of leaking memory. It's likely it makes some initial allocations that are not the leaking ones.
- Take one heap snapshot.
- Continue using the functionality for a while, preferably without running anything else in between.
- Take another heap snapshot. The difference between the two should mostly contain what was leaking.
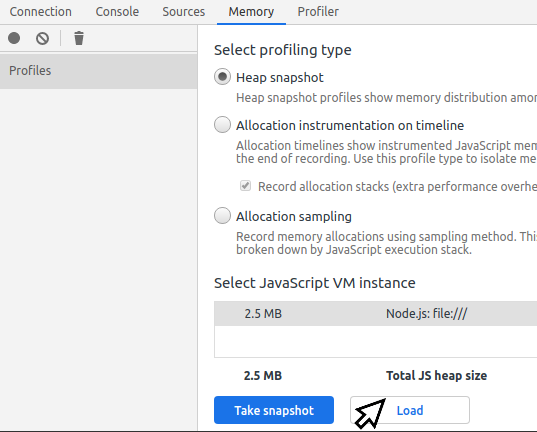
- Open Chromium/Chrome dev tools and go to Memory tab
- Load the older snapshot file first, and the newer one second.
- Select the newer snapshot and switch mode in the dropdown at the top from
Summary to Comparison.
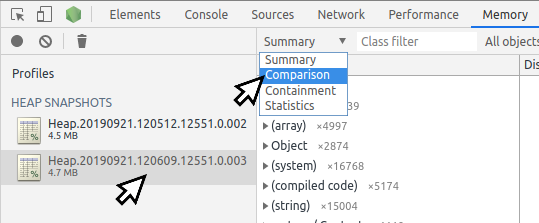
- Look for large positive deltas and explore the references that caused them in the bottom panel.
You can practice capturing heap snapshots and finding memory leaks with this heap snapshot exercise.